
Linear Regression Workbook
Foundation AI by hand ✍️

I’m starting the new Foundation series — free for everyone who wants to build a solid math foundation for AI, the AI by Hand ✍️ way. While the paid Frontier series is for advanced AI engineers and researchers, Foundation is for learners and educators who want to master the math and intuition that make those breakthroughs possible.
Linear regression is the foundation of data science — a skill that’s more important than ever when everyone around you is busy rebranding themselves as AI engineers. I genuinely believe a skilled data scientist is ten times more valuable than an inexperienced AI engineer.
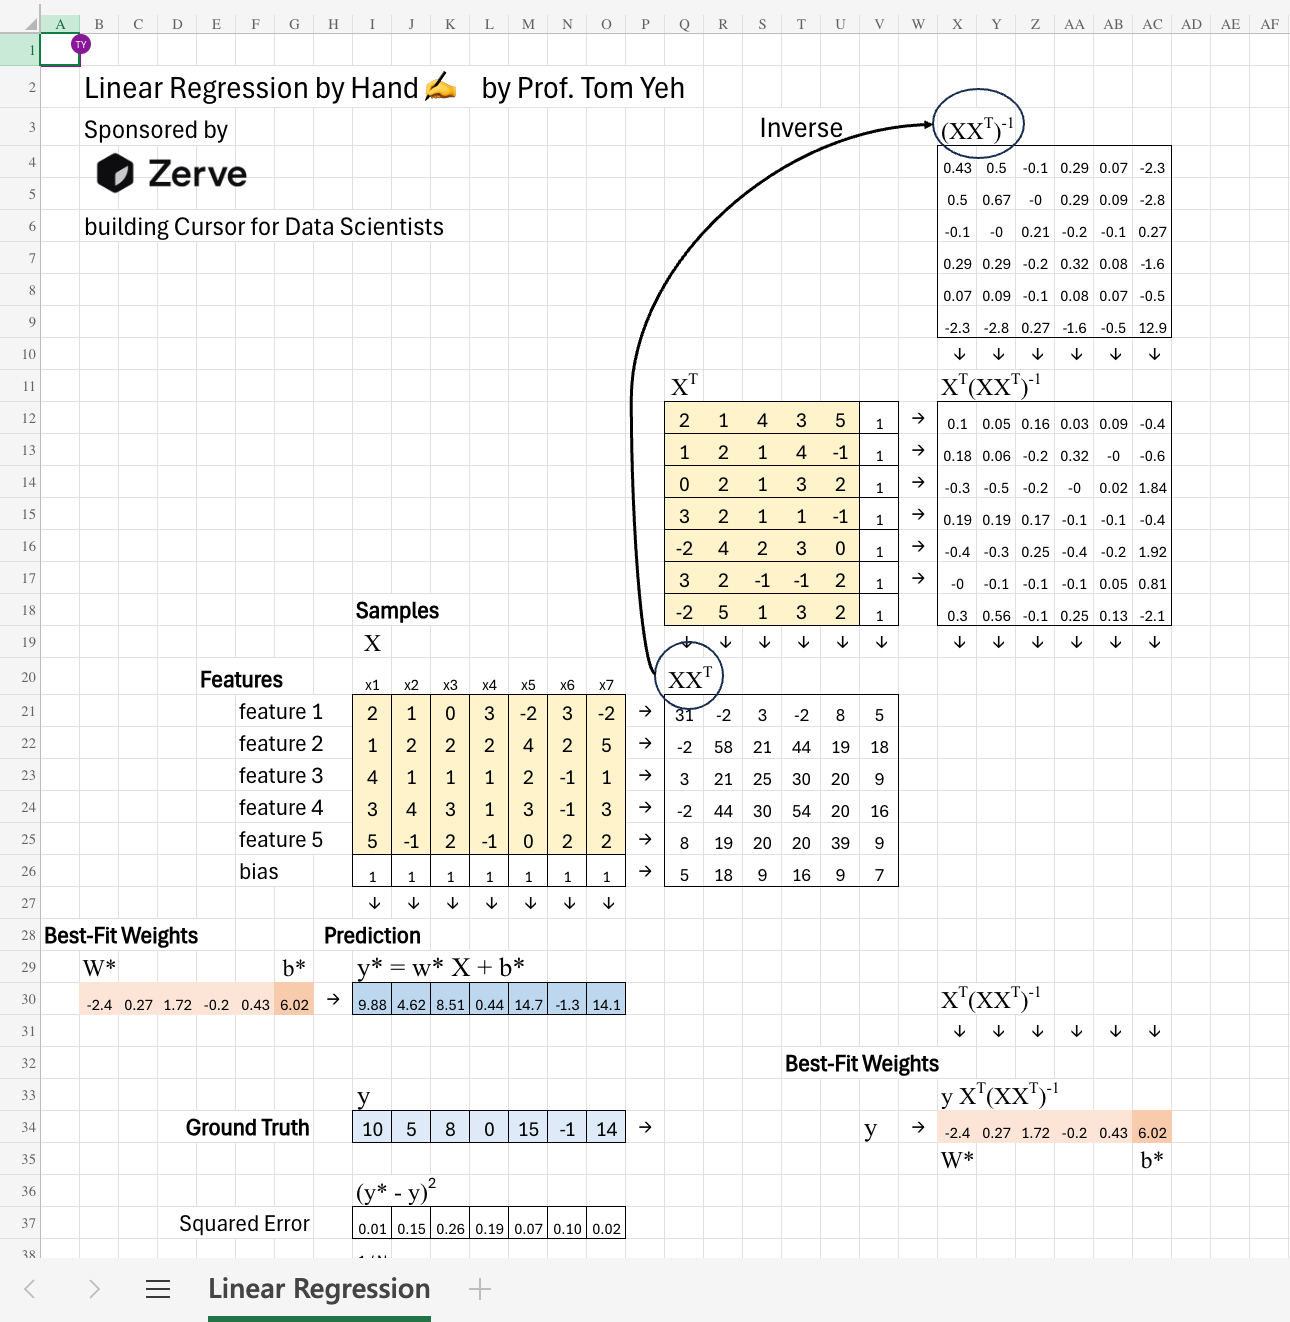
For those of you who are still interested in a career in data science, I created this exercise to walk you through linear regression by hand ✍️ inside Excel, so you can see every matrix operation unfold right in front of you and finally understand what these two lines mean:
w = y @ X.T @ np.linalg.inv(X @ X.T)
y_pred = w @ X
(Sponsored by Zerve, building Cursor for Data Scientists. Please take a moment to check out the sponsor to support my work!)
Click here to view this Excel exercise online
(p.s., Download your own editable copy by File > Create a Copy > Download a Copy)
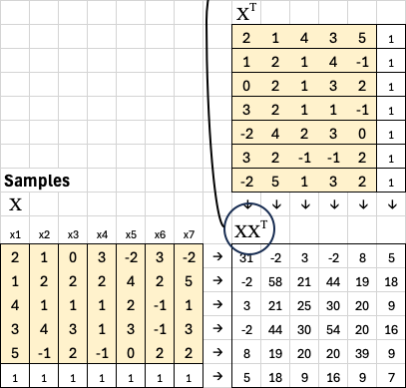
We begin with seven samples: x1 through x7. Each sample represents one column in our dataset, and each has a corresponding ground truth value y1 through y7.
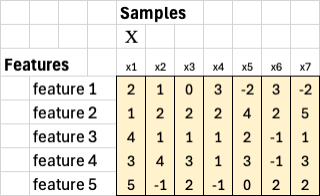
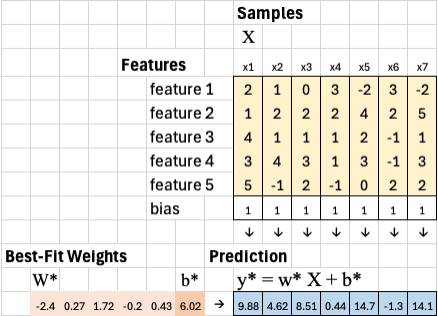
Each sample has five features. This means our feature matrix X has 5 rows and 7 columns — five features by seven samples. Each column corresponds to a single example, and each row represents one feature across all samples.
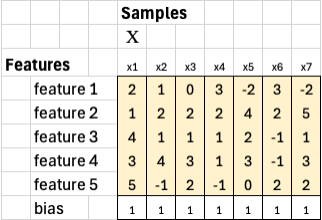
To include a bias term, we add one extra row of ones to X. The new matrix now has 6 rows and 7 columns. The bias row allows the model to learn an intercept in addition to feature weights.
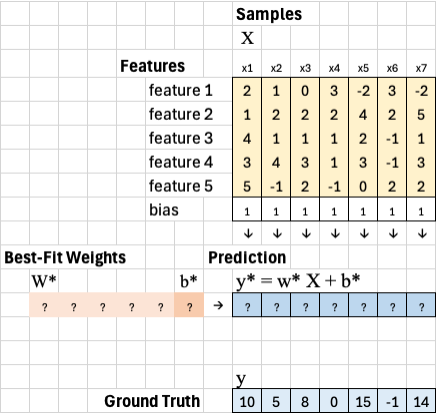
The goal is to find the set of weights that best fit the relationship between our input features and the ground truth values. In other words, we want to determine how much each feature contributes to predicting y* to be as close to ground truth values y as possible. Once we express this relationship in matrix form, we can solve for those optimal weights using a series of simple linear algebra steps.
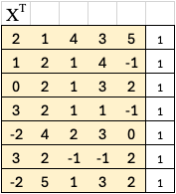
To solve for optimal weights, first, we take the transpose of X. Transposing flips rows and columns, so X^T now has 7 rows and 6 columns. Each row in X^T now represents a sample, and each column represents a feature (including the bias).
We then multiply X by its transpose: XX^T. Since X is 6x7 and X^T is 7x6, the result XX^T is a 6x6 matrix. This captures how the features co-vary across the dataset and is often called the covariance matrix.
The next step is to compute the inverse of this covariance matrix. This inverse is essential because it lets us correct for correlations between features.
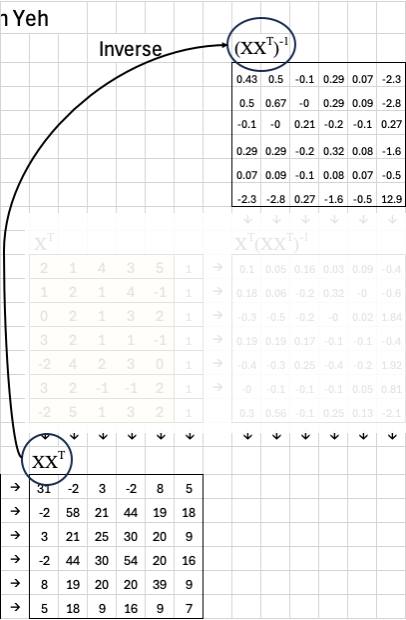
Now, we multiply the transpose of X by this inverse:
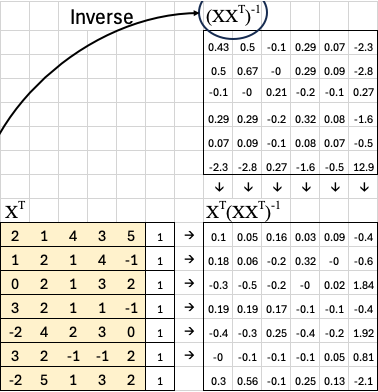
This matrix — which I like to call the “magic matrix” — gives us a direct way to compute the best-fit weights. In more formal terms, it’s known as the pseudoinverse of X.
We then multiply this magic matrix by the ground truth vector y or equivalently, This gives us the optimal weights (and bias) that minimize the squared error between predictions y* and grouth truth values y.
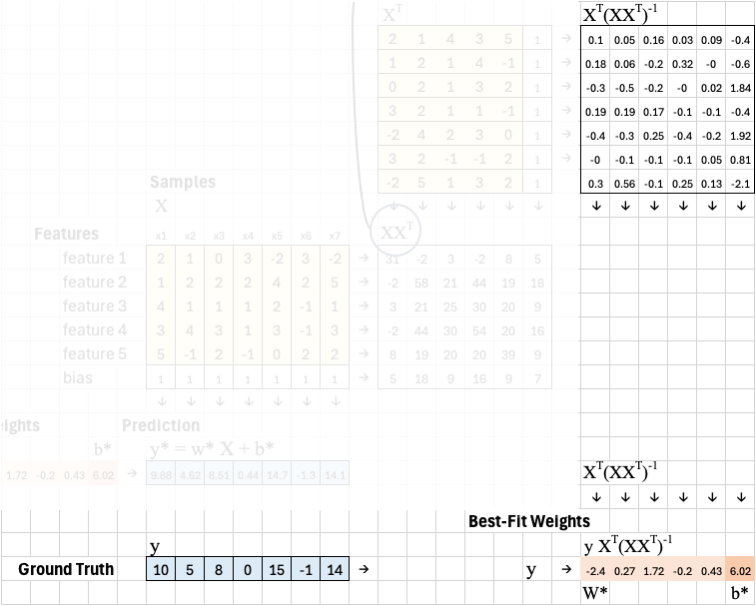
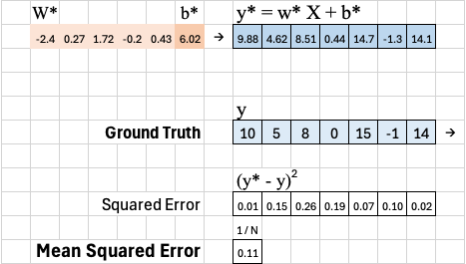
Once we have the optimal weights, we apply them back to the original training samples to generate the predicted outputs y*. This is done by multiplying the weight vector w* and bias b* with each column of the feature matrix X, including the bias row of 1s. This gives us a set of predicted values, one for each training sample.
We can then compare these predictions to the ground truth y to see how closely the model fits the data. We calculate the squared error for each sample as: (y* - y)^2. Taking the average of all these squared errors gives the mean squared error (MSE), which represents the smallest possible error for this model.
Finally, once we have the learned weights and bias, we can apply them to new data columns to predict their corresponding outputs.
Before we wrap up, I want to give a big thanks to Zerve for sponsoring me to create this exercise. Zerve is an Ireland-based startup founded by Phily Hayes, building an agent platform designed for data scientists. When I spoke with Phily, he told me their agents can actually perform the same kind of calculation we just walked through. I did not quite believe initially, until he showed me this:
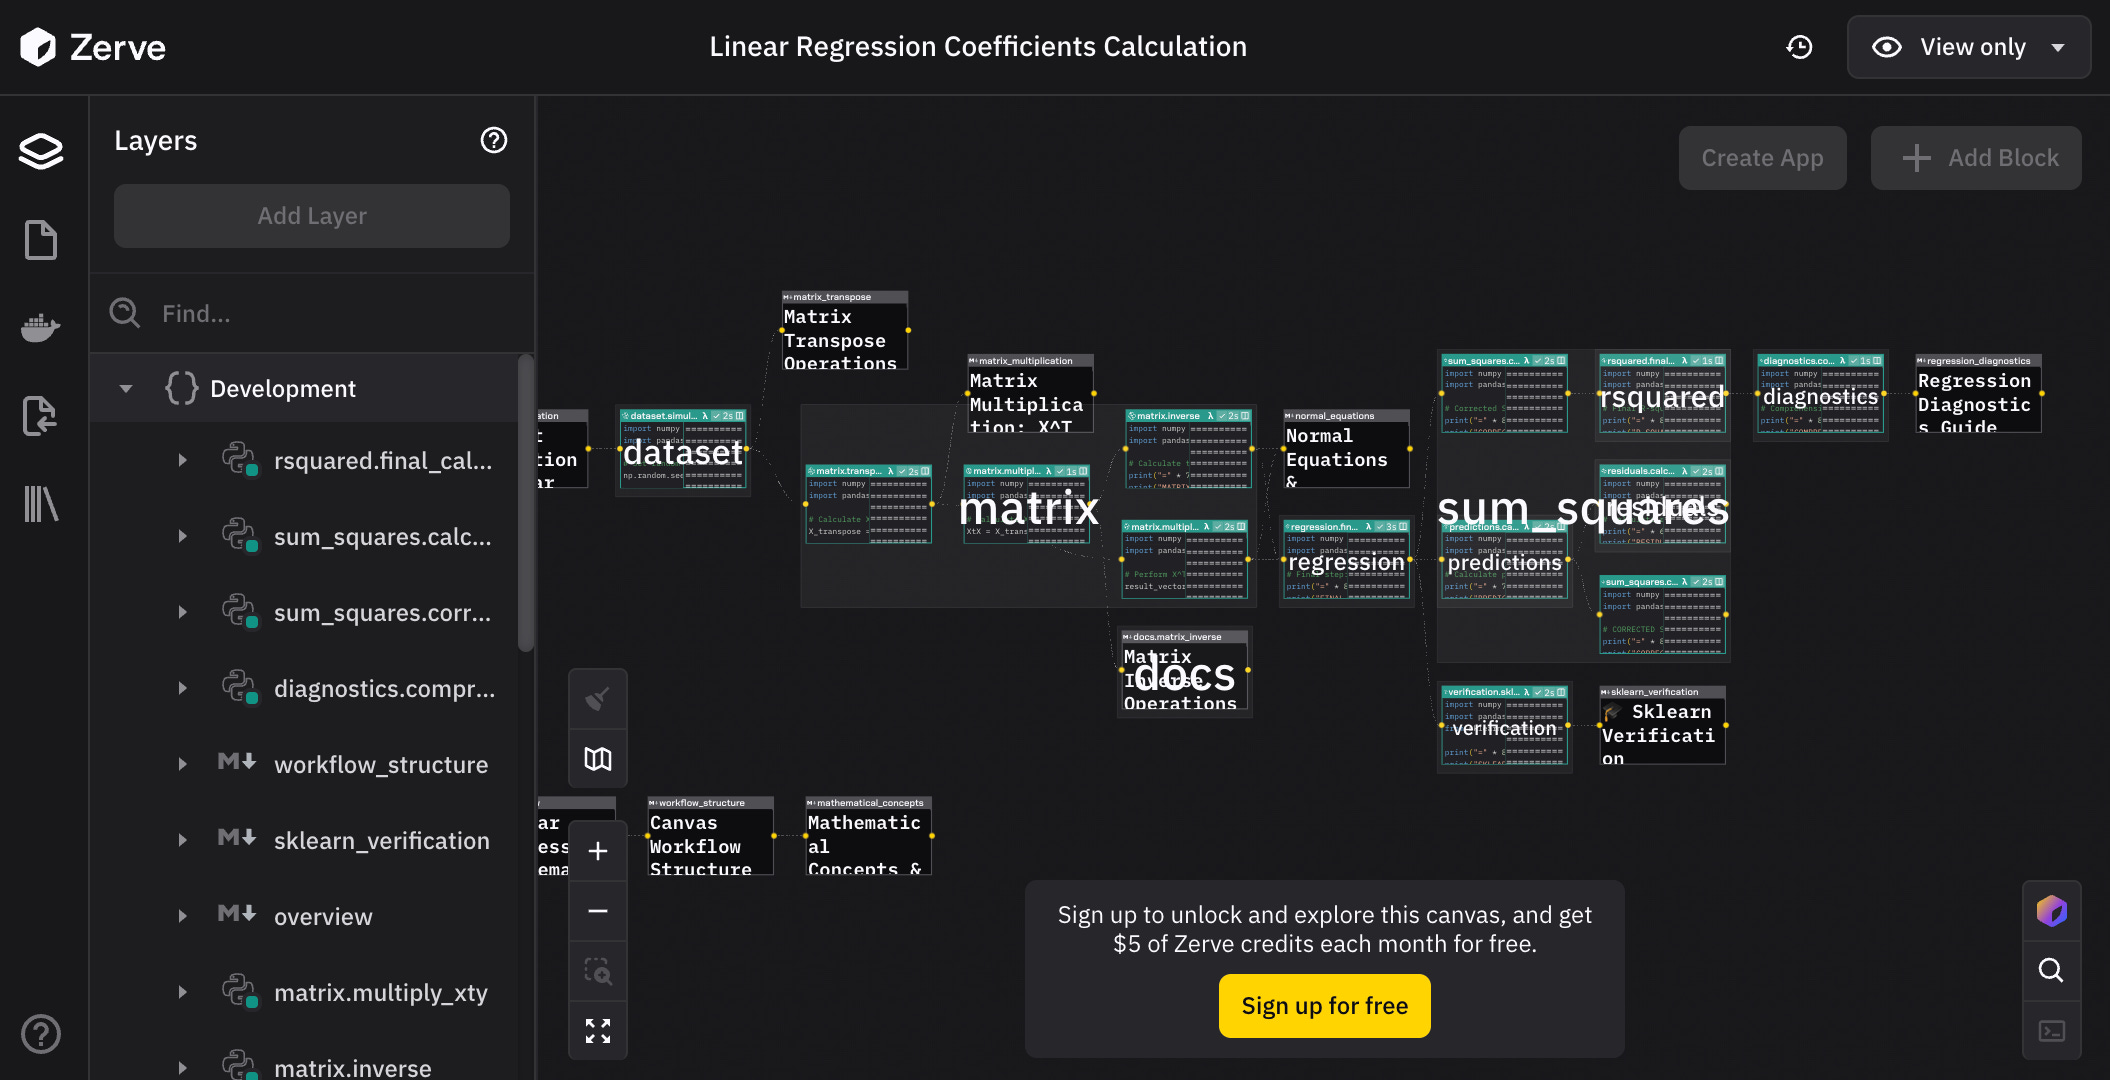
Please take a moment to checkout Zerve.
Amazing work. Thanks a lot
Perfect timing! We’re covering this in my EECS class right now