
The Architect: New Open Source Tool from the AI by Hand Lab


I want to share with you the first functional prototype of Architect—a new open source tool created by Jubair, my PhD student, to generate AI by Hand neural network architecture blueprints directly from an Excel workbook.
⚙️ System requirement: An active Microsoft Office 365 subscription is required, as the tool relies on Office Scripts.
🔗 Link to View the Architect Online (Excel workbook)
🔽 Download a local copy of the workbook to try yourself
Examples
Example 1: Linear Layer
Input tensor X: feat = 3, batch = 1
Layer 0: Linear(3 → 5)
Example 2: Linear Layer + ReLU
Input tensor X: feat = 3, batch = 1
Layer 0: Linear(3 → 5)
Layer 1: ReLU
Example 3: Two Layers
Input tensor X: feat = 3, batch = 1
Layer 0: Linear(3 → 5)
Layer 1: ReLU
Layer 2: Linear(5 → 7)
Layer 3: Softmax
Example 4: Batch of 10
Input tensor X: feat = 3, batch = 10
Layer 0: Linear(3 → 5)
Layer 1: ReLU
Layer 2: Linear(5 → 7)
Layer 3: Softmax
Introduction
(written by Jubair)
Hi there,
Thank you for your interest in the Architect! I’ve been working on this for a long time, and this prototype is implemented entirely within a single Excel workbook.
When you open the workbook, you will see two tabs: the Architect tab and the Blueprint tab.
For years, Prof. Tom Yeh, my PhD advisor, has been building numerous Excel Blueprints of deep learning architectures entirely by hand. He also forced me and many others students to build blueprints by hand in classes and research projects.
I have had enough. So I decided to threaten simplify Prof. Yeh’s job by creating the Architect, a tool that can automatically generate new blueprints. 😉
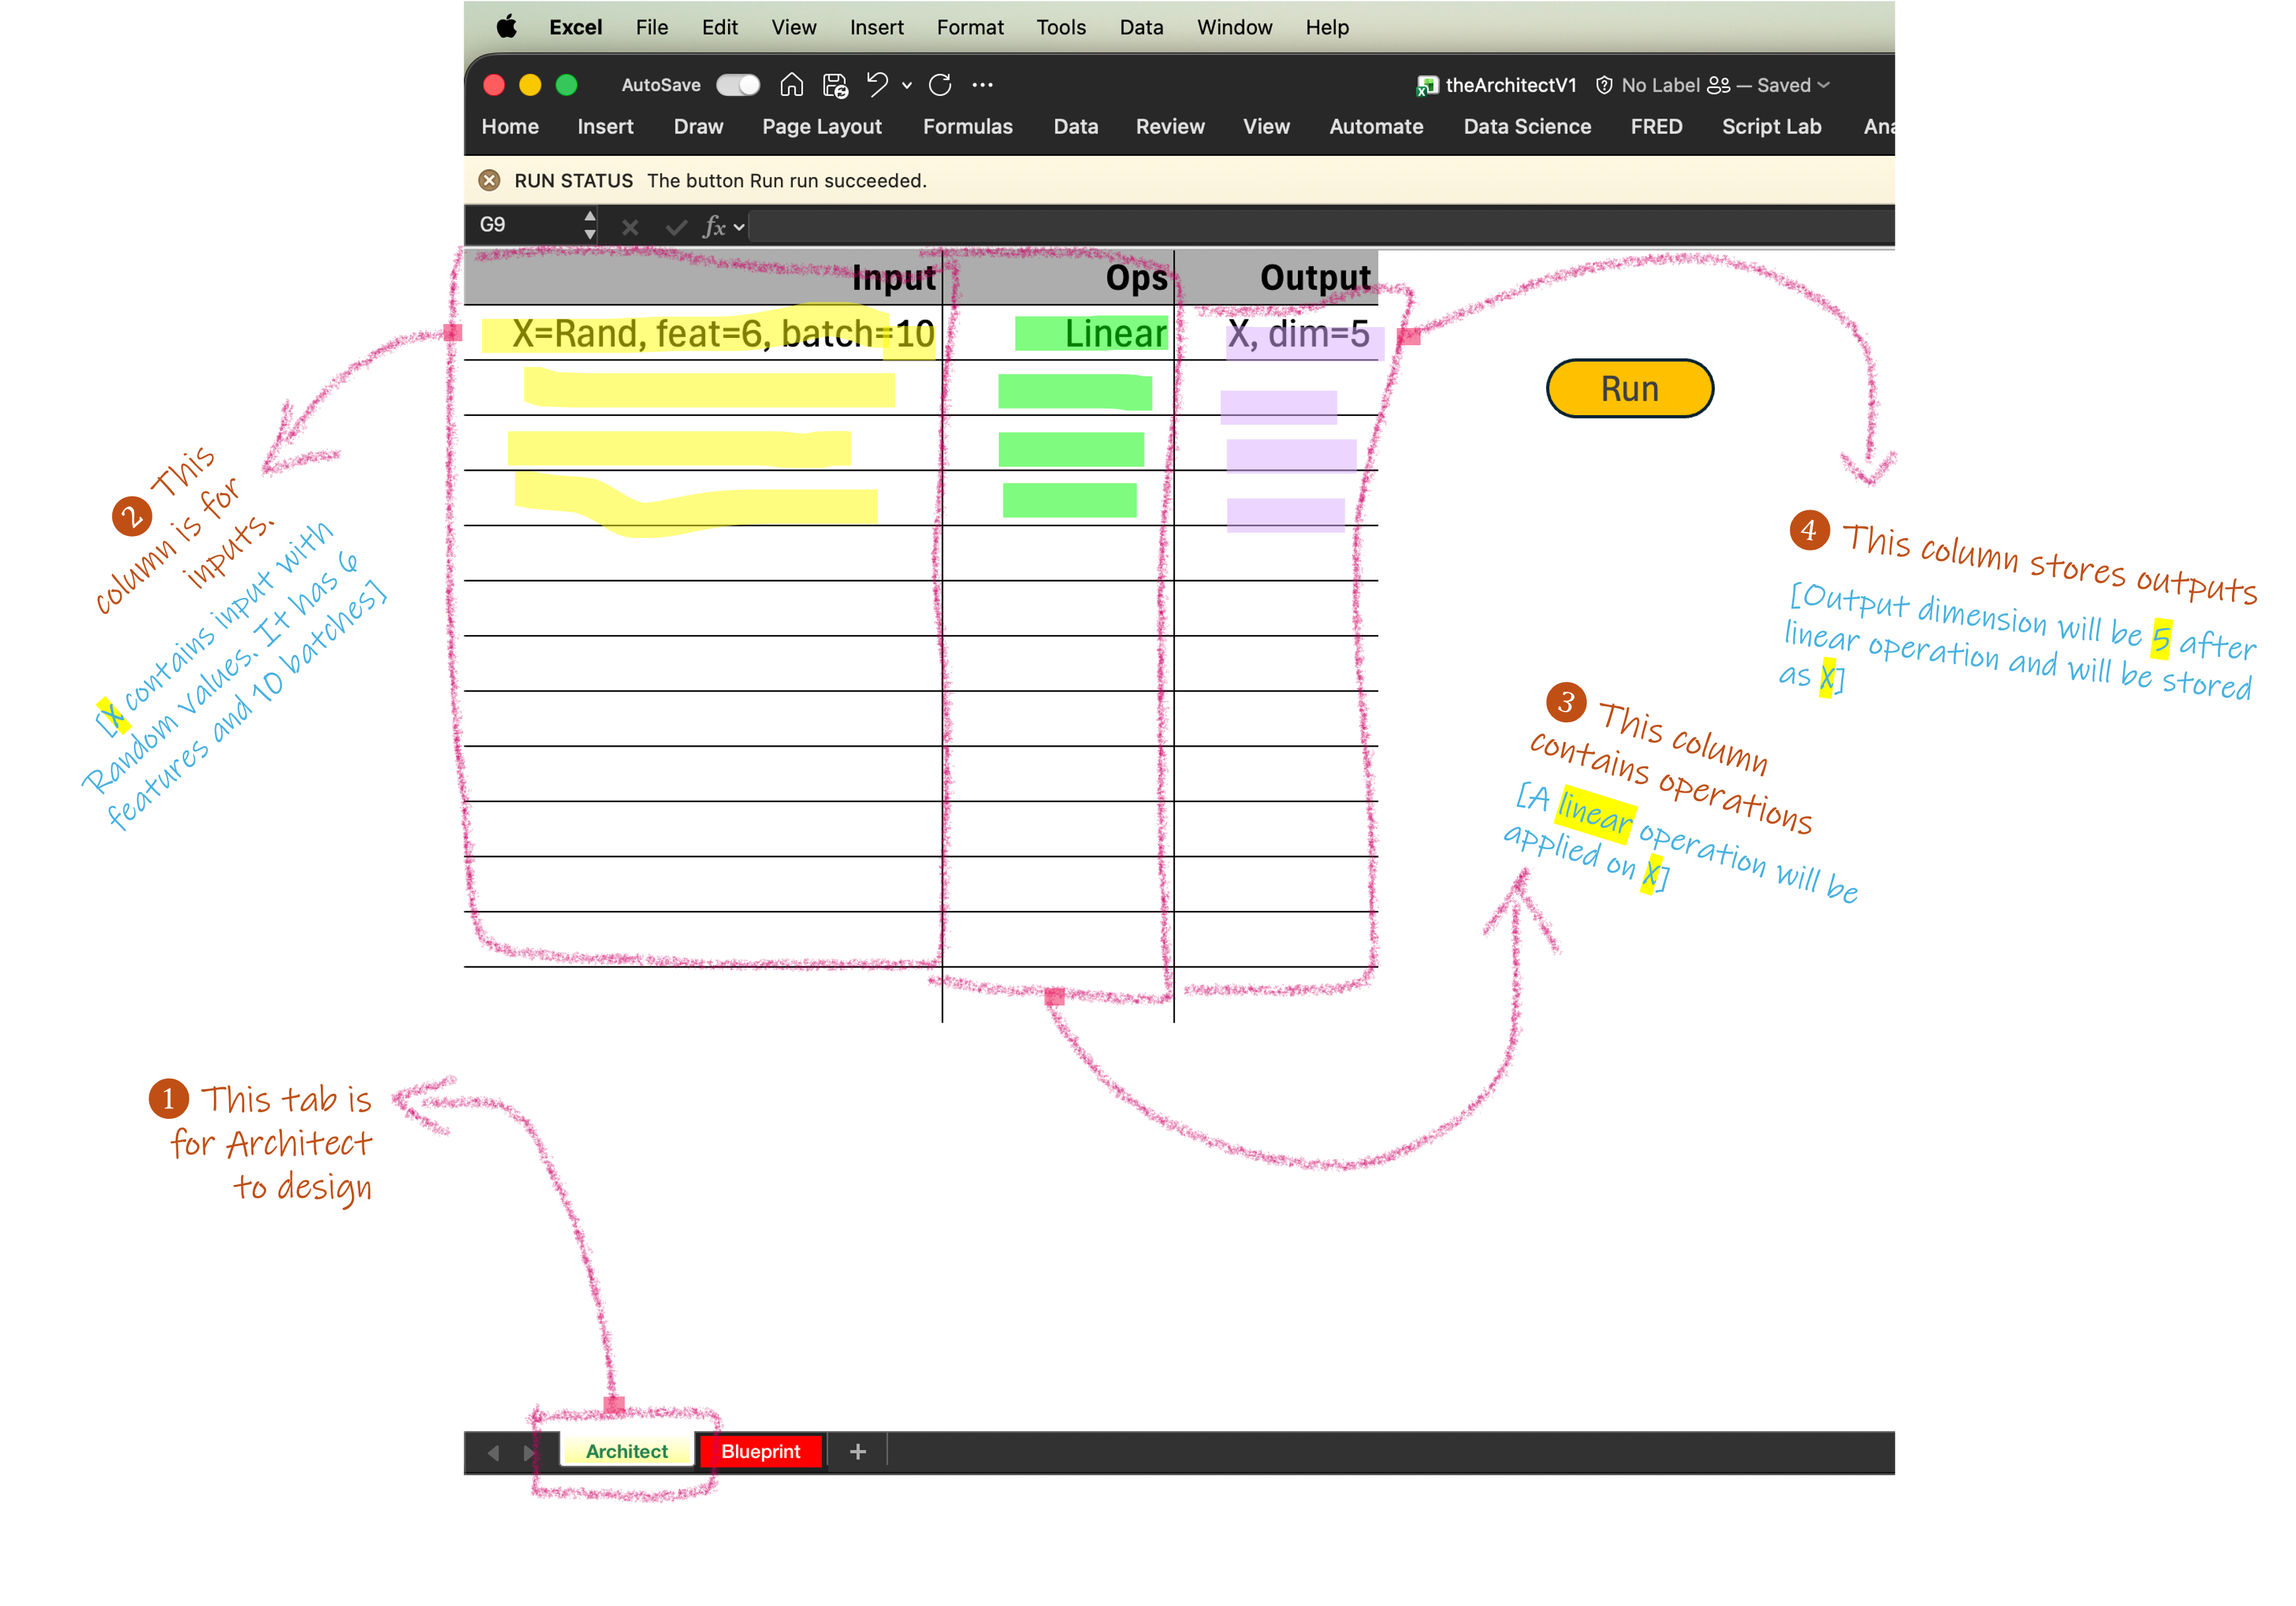
Input (Architect)
Think of the Architect tab as a planning table. Instead of writing code, you describe your model step by step, one row at a time. Each row answers three basic questions: What is the input? What operation should happen? What should come out?
The Input column is where tensors are defined. In this example:
X = Rand, feat = 6, batch = 10 It means: create a random input tensor with 6 features and 10 batch elements—we give it a name X. You don’t need to worry about arrays or indexing—Excel handles that for you.
The Ops column describes what to do with that input. You can write—
Linearwhich means applying a standard linear layer (a matrix multiplication plus bias). This is the same operation used in most neural networks, just written in a human-readable way. In the current version (V1) available operations are: Linear, ReLU and Softmax.
The Output column records what you expect after the operation. We give—
X, dim = 5and it tells The Architect that the Linear layer should map the 6 input features down to 5 output features, producing a new tensor. This will be stored as a variable X.
Output (Blueprint)
Once you click Run in the Architect tab, the design is expanded into the Blueprint (see Fig-2). This is where the abstract description turns into something concrete and explorable.
At the top of the Blueprint, you see the input tensor laid out as a grid. Each row represents a feature, and each column represents a batch element. This makes the shape of the data immediately visible, without needing to read tensor notation or code.
Below that, each operation is unfolded into its full computation. For a Linear layer, the Blueprint shows the weight matrix, the input tensor, and the resulting output tensor, along with the exact math (X₀ = W₀X + b₀). Every number you see is backed by an Excel formula, so nothing is static or precomputed. You can change a value and watch the effect propagate through the network.
On the right side, the Code panel shows the matching PyTorch code, generated layer by layer. This lets you directly connect what you see in the Blueprint with how the same model would be written in practice. The visual blocks and the code blocks stay aligned, making it easy to cross-check understanding.
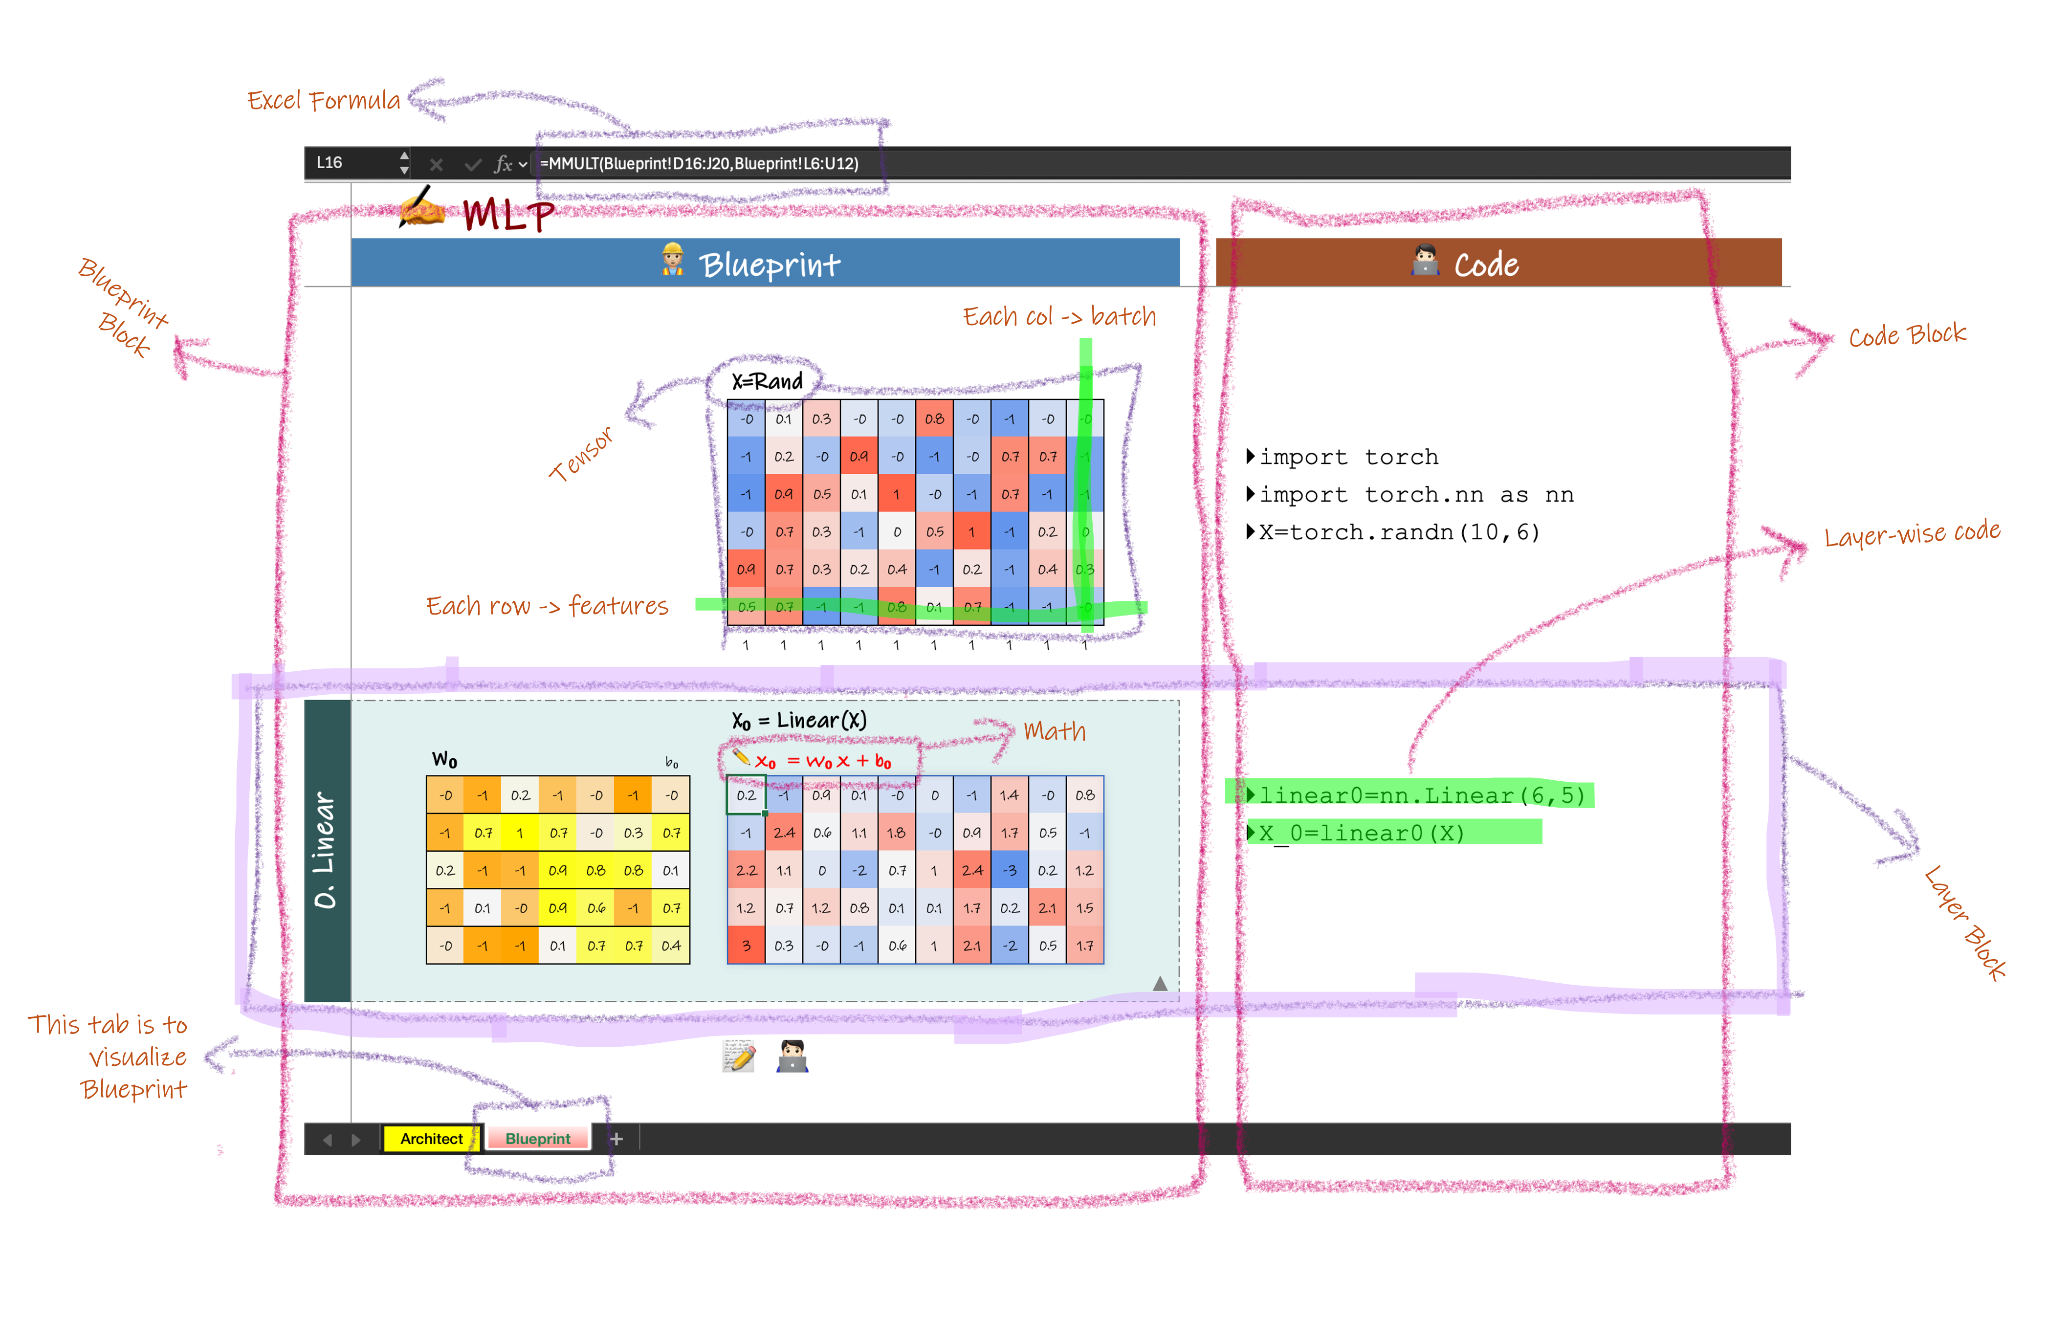
The Blueprint tab allows you to trace how data flows, how shapes change, and how math turns inputs into outputs. Instead of treating neural networks as black boxes, the Blueprint turns them into something you can read, inspect, and reason about—one layer at a time.
Design Philosophy
I designed and developed the Architect with a few core requirements that prioritize clarity, familiarity, and learning by doing.
1. Use Excel as the native environment.
Excel is already widely known and easy to use. Most users do not need to learn a new interface, language, or tool before they can start exploring neural networks. By running entirely in Excel, the system removes onboarding friction and lets users focus on understanding the model rather than the software.
The Architect is implemented using Office Scripts, which currently run within Microsoft 365 Academic accounts. This means access to an educational Office 365 license is needed to use the system in its current form. For many students and educators, this is already part of their existing setup.
2. Make tensor shapes and dimensions visible at all times.
Tensor shapes and dimensions must be explicitly shown and easy to track throughout the network. The layout follows a consistent pattern: weights are always placed on the left, and columns consistently represent the batch dimension. This stable visual structure helps users follow the data flow without mentally reconstructing shapes.
3. Reveal the math behind every operation.
Each layer exposes its underlying mathematical operation rather than hiding it behind a function name. Combining mathematical formulas with concrete tensors and numbers creates a unique learning experience where users can directly connect equations to actual values.
4. Link visualization directly to PyTorch code.
For every visual block, the system provides the corresponding PyTorch code. This allows users to verify the math, tensor operations, and implementation side by side. Seeing the visualization, formulas, and code together makes the overall process easier to understand and trust.
5. Represent tensor values using Excel formulas, not fixed numbers.
Tensor entries are expressed as Excel formulas rather than static values. This gives users the freedom to modify inputs, weights, or operations and immediately observe how changes propagate. Users can experiment, play, and align spreadsheet formulas with mathematical expressions in a natural and flexible way.
Feature Roadmap
Here’s a roadmap of the features I’m working on adding to the Architect. I plan to release updates regularly, as outlined below:
Foundations (Available now)
Random Input, Linear, ReLU, and Softmax.
Learn how tensors flow through a network and how raw values turn into probabilities.
👉 This is the version covered in the current post.Better Nonlinearities
Adds Tanh, GELU, and LayerNorm.
Explore how different activations behave and why normalization matters in deeper networks.Learning Signals
Adds One-hot Encoding, Cross-Entropy Loss, and Mean Squared Error.
See how predictions meet targets and how loss becomes a computable, inspectable object.Beyond Vectors
Adds Images, Simple Augmentation, and Flattening.
Understand how the same matrix-based reasoning extends naturally to visual data.
Hope you enjoy using the Architect—let me know what you think in the comments.
 | A guest post by
|
Great tool
Fantastic!! Not only a clear, hands-on representation of various models, but also the translation into PyTorch. An exceptional learning tool. Congratulations to Jubair!!